
How I’m Navigating the Market’s Cross-Currents
By: Steve Smith
Major indices such as the S&P 500 Index (SPY), Nasdaq 100 (QQQ), and Russell 2000 (IWM) are all within 2% of all-time highs. But, this bellies the below-the-surface turmoil occurring. I’ll be using a lot of images to illustrate the cross currents. As you know, a picture’s worth 1,000 words. And given the way I write, it’s more like 2,000.
Gain exclusive access into the Options360 Concierge Trading Service for only $19!
The fast-and-furious rotation among sectors such as growth, value, commodities, and how consumer spending will trend during the re-opening, has created a market of cross currents that spin day-to-day.
Also, economic data has become very noisy. One day a strong report comes in on jobs, or gross domestic product, followed by another data release on unfilled jobs or inflation, paints a different picture.
This chart compares the QQQs to the SPY, S&P Financials (XLF), and S&P Energy (XLE) performances over the past 9 months — about when vaccines were approved. The main takeaway is the dramatic rotation from big-cap tech QQQ into cyclical sectors such as XLF and XLE.
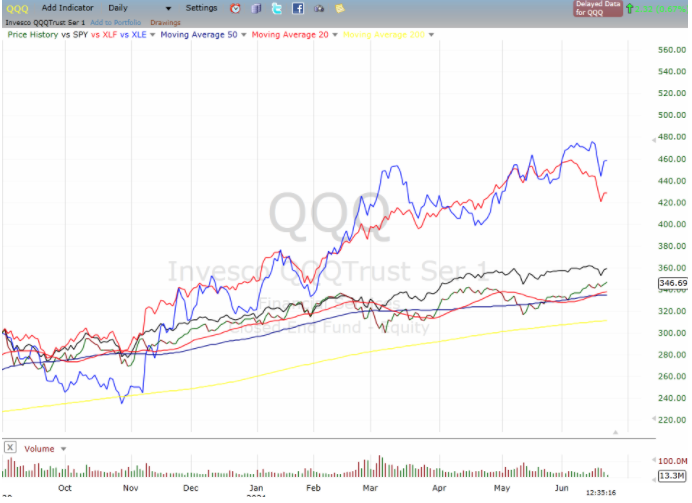
As you can see, the liquidation of out-of-tech in money flow, which went negative for the first time since the pandemic hit some 19 months ago. Also note, the SPY and QQQ had their worst in over 2 months on Friday. But, they were completely reversed by today. And they’re basically level from 5 months ago — that’s a lot of churn-and-burn.
Get full unrestricted access with this crazy $19 Options360 Concierge Trading Service promotion!
However, just as it seemed tech, especially the high valuation “new” companies such as ZOOM (ZM), could continue to fall, the rotation reversed and QQQ’s outperformed the SPY and IWM over the past two weeks
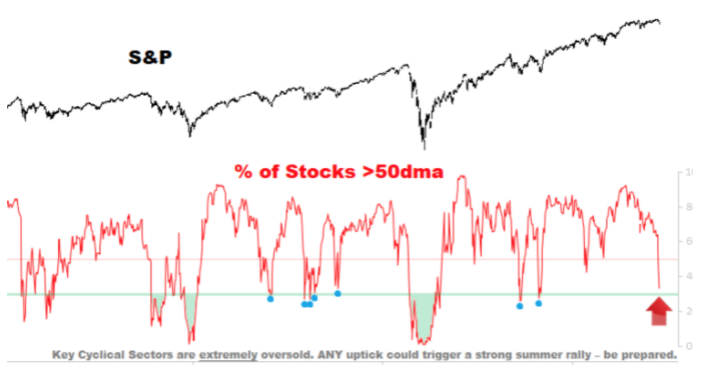
Again, what’s amazing is how this rotation kept the headline indices at all-time highs, but we’re getting oversold readings. Namely, breadth has contracted and nearly 5o% of S&P 500 stocks are back below their 50-day moving average. And over 65% have had a 15% pullback within the past two months.
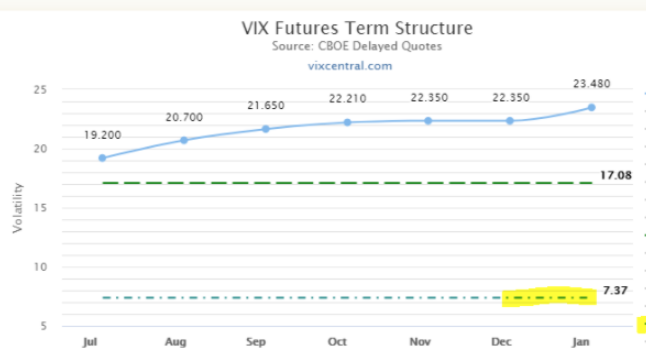
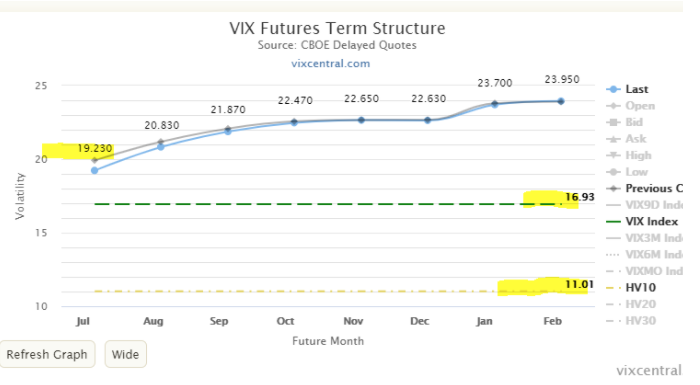
As we turn toward sentiment reading, we also get a very mixed picture. In this article last week I discussed how the VIX, and its trading proxies, despite hitting post-pandemic lows, were still trading at large premiums to the realized or historical volatility. And, it might not be prudent to use them as a vehicle for hedging against a sell-off.
You can see that volatility, over the past few days, caused HV to jump from 7.37 to 11.02 — a 50% increase. Meanwhile, the cash VIX and the VIX futures barely budged.
VIX Term Structure on 6/15
VIX Term Structure on 6/22
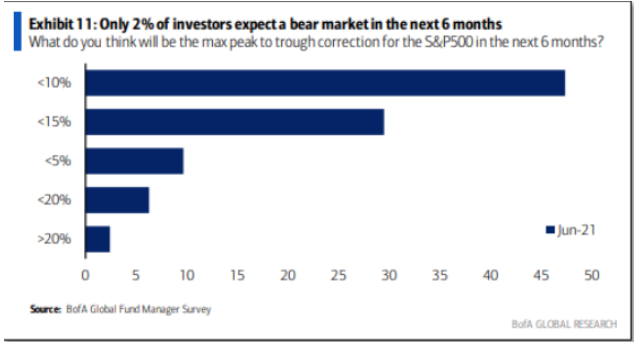
Other sentiment readings are also sending mixed messages. A recent Bank America (BAC) report indicated that less than 2% of people expect a bear market over the next six months, less than 30% expect a 10% correction. Reminder: Over the past 20 years, the stock market experienced two 10% corrections over any 12-month period. Is this a form of complacency?
Only 2% of investors expect a bear market in the next 6 months.
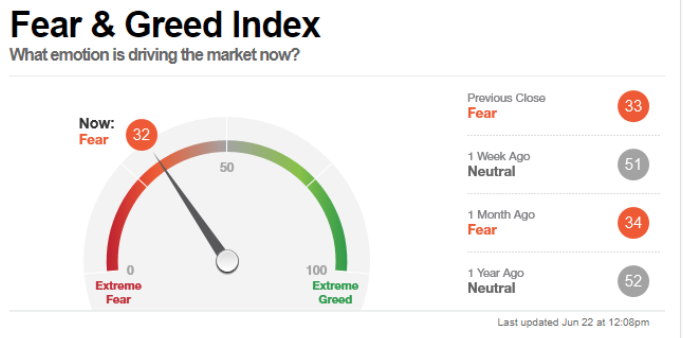
But, then we look at Fear and Greed Index, which shows that people continue to show more concern than greed. It dropped from a mere neutral one week ago to the current 32 reading of fear.
What is one to make of this mess of tea leaves? For the Options360 Concierge Trading Service, we’re sticking with what works, namely patiently waiting for good risk-reward setups and employing an appropriate options strategy with a defined risk-reward.
I still have a bullish bias, but it’s on a tiger leash. The number of new trades initiated has slowed down. Even so, I’d rather be disciplined than try to capitalize on every market twitch.
About author

Subscribe To OurDaily Newsletter
Join our mailing list to receive the latest news and updates from Option Sensei.