Revenge of the Old Economy
By: Steve Smith
Yesterday, I wrote about the Divergence between Wall Street and Main Street. Today, I want to look at the divergence, or I should say reversion, in the performance between old economy (legacy companies) and new ‘disruptive’ stocks.
First, let’s remember that the major indices such as the SPDR S&P500 (SPY) and Powershares Nasdaq 100 (QQQ) were propped up by the 6 mega-cap tech stocks (MSFT, AAPL, etc.) which accounted for over 40% of those indices gains in 2021. But, under the surface — for the past three months — there has been a variable bloodbath.
It’s only in the past few days that some of the FAANMG names have come under some pressure, decreasing the SPY a mere 2% from all-time highs and QQQ off 4% from all-time highs.
However, as they say in the publishing business, the nut graf is “fundamentals or valuation didn’t matter on the way up, so why would you think they should matter on the way down.”
Hence, it’s sensible that stocks with a positive cash flow, pay dividends, and have tangible assets, are finally getting some love compared to the moonshots of space exploration, and electric vehicles. The point is that a plethora of speculative non-profit companies saw their stocks gain 200% – 400% from 2020 lows to peak in 2021; just because they’re down 50% doesn’t mean that they’re now cheap.
I’m going to let charts do the heavy lifting for me today as a picture’s worth a thousand words. Or, if it’s an NFT, it’s worth a million.
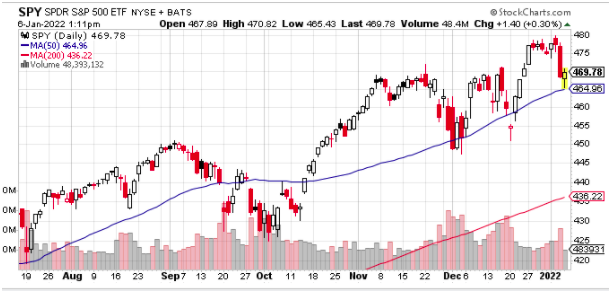
Let’s start with looking at the SPY vs. the Cathie Wood-run Ark Innovation Fund (ARKK), which holds a very concentrated portfolio of ‘disruptive’ but mostly profitless companies.
The SPY was up some 24% in 2021 and still holding an uptrend at the 50-day moving average.
ARKK is down 42% from the 52-week high and off 15% in 2021.
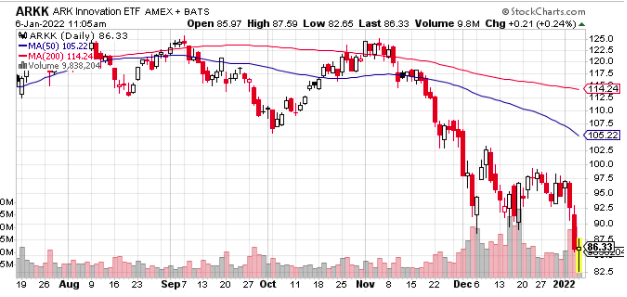
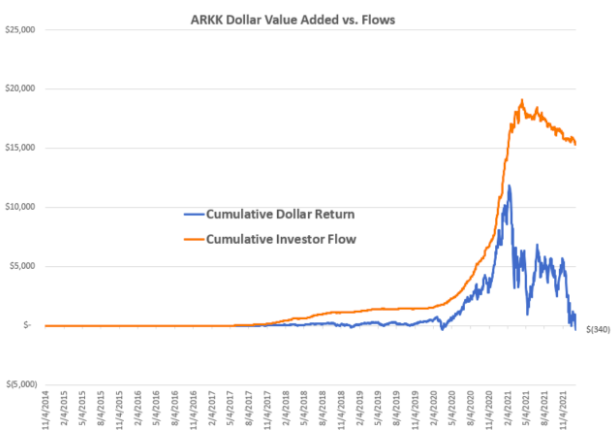
What’s worse regarding ARKK is that it became a victim of its own success as it brought in over $32 billion near its peak. In other words, despite gaining over 130% in 2020, most ARKK investors are down over the past two years.
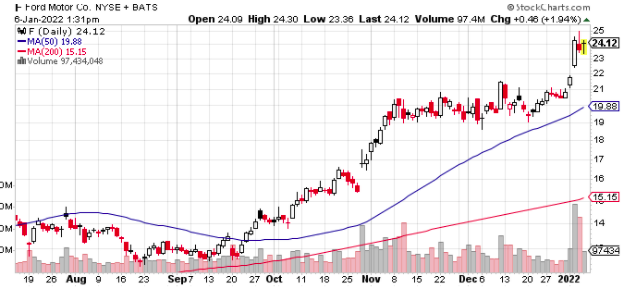
However, I come not to bury ARKK, but to tout how the traditional legacy businesses with an established brand and user base have come roaring back to life. We know oil and other commodity/manufacturing companies have returned thanks to a rotation out of growth and into value. But, let’s look at some side-by-side comparisons.
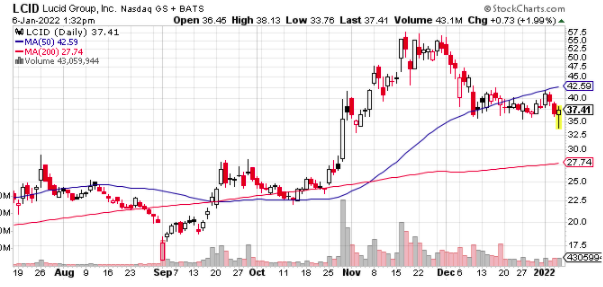
In the electric vehicle space, Ford (FORD) has surged 25% in just the past 2 months while Lucid tumbled 35% in that same time frame.
Lucid Group Inc. (LCID)
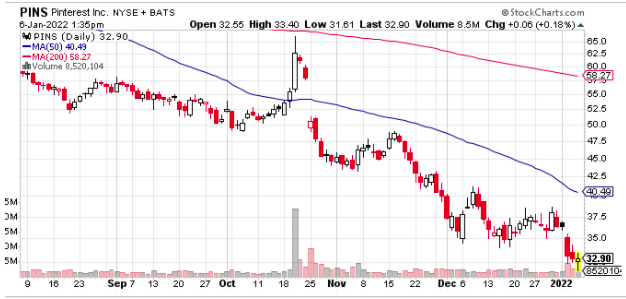
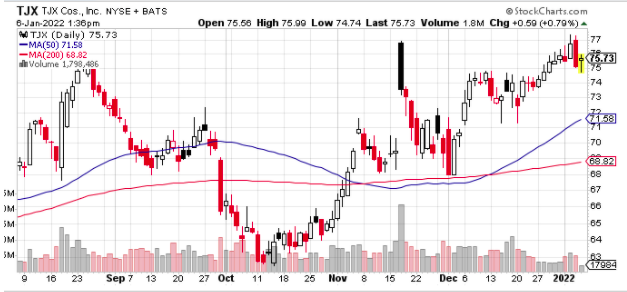
How about online retail such as Pinterest (PINS) vs. a traditional brick-and-mortar such as TJ Max (TJX)?
TJX
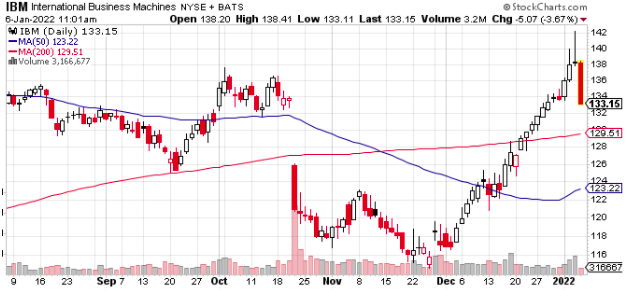
How about an old-line tech such as IBM — which could do no right for nearly a decade as it was lost in the wilderness of new cloud-based companies — recently ramping straight up 20 out of the last 23 trading days. It did encounter selling today, but still a heck of a move.
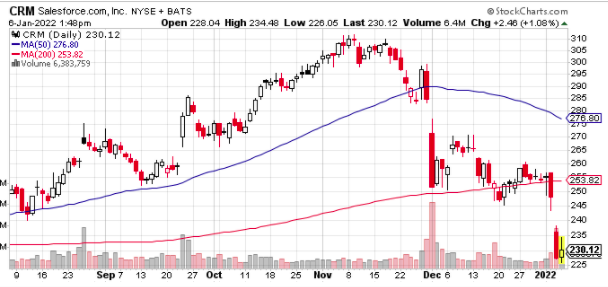
On the other hand, Salesforce (CRM) known as a darling and emblematic of the shift to cloud-based enterprise software eating the world, has been crushed lately.
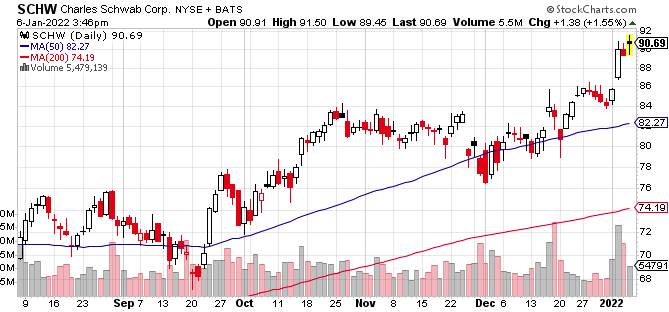
What about Fintech? Robinhood (HOOD) has seen its market cap drop from $60 billion to $11 billion and some 50% below the IPO price while Schwab (SCHW) has done just fine.
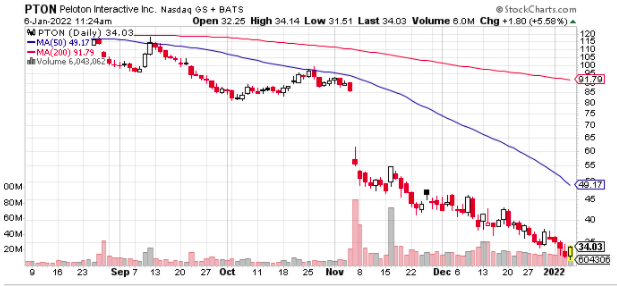
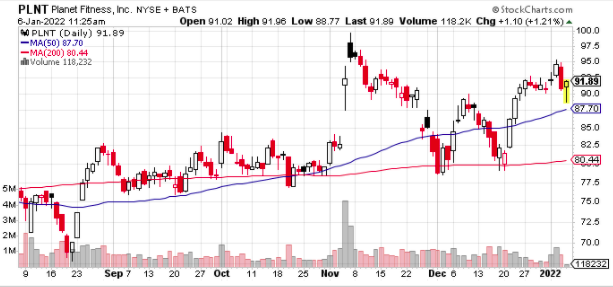
Next up is the exercise space. Even as Omicron spreads the workout-from-home play, Peloton (PTON) continues to get crushed while traditional gym operator, Planet Fitness (PLNT), works its way higher.
PTON is pooped out.
PLNT is getting pumped.
There’s an old saying that in the short-term, the stock market’s a voting machine. But in the long-term, a weighing machine. Meaning that while storytelling can move a stock valuation is what ultimately matters.
The question is whether any of these new disruptors can renew their growth narrative towards profitability. I’m building a list and will check it twice. However, in the meantime, the old-line companies are getting a second life.
About author

Subscribe To OurDaily Newsletter
Join our mailing list to receive the latest news and updates from Option Sensei.