


There’s a general feeling floating around Wall Street that there’s nothing bullish about stocks right now, except price action.
There are always periods, especially on shorter time frames, where fundamentals don’t necessarily align with technicals. I think the old saying “In the short run, the market is a voting machine but in the long run, it is a weighing machine” is somewhat applicable, however, does not fully explain the disconnect occurring at the moment.
Most everyone came into 2023 expecting a rough first half on expectations that continued rate hikes would lead to economic contraction, if not a full blown recession.
Instead, January was one of the best months on record as economic data remained robust and inflation began to ebb, lending credence to the notion of a ‘no landing’ scenario.
Following the recent mini-banking crisis expectations are now for an even more severe contraction as both demand for loans, which the yields or the cost to borrow are significantly higher, and the desire to lend due to risk factors, have fallen off a cliff.
Instead of the market rolling over, we have seen a sharp rebound since the bailout/backstop of bank deposits was put in place on March 1. Since then, the Nasdaq 100 (QQQ) has rallied over 8% and the SPDR 500 (SPY) is up 3.9% in the past two weeks.
So, what gives? And why do I think this rally is built on shaky ground and is not sustainable?
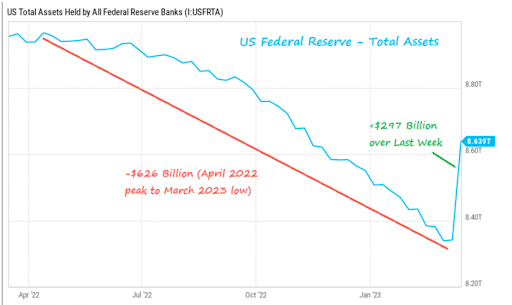
First, I would point out that the Fed’s response to the bank failures has led to a huge injection of liquidity. In the past two weeks, they have reversed half of the $626 billion drained from its balance sheet over the prior year. Basically, we have gone from Quantitative Tightening back to Quantitative Easing.

Once again, much of that money is finding its way back into the stock market. However, it is far from being spread evenly. Instead the bulk of the buying, and accounting for nearly the entire rally, are large-cap tech names, which became viewed as safe havens by money managers who need to maintain a certain allocation of equity exposure.
Currently, Apple (AAPL) and Microsoft (MSFT) account for a whopping 14.6% and 5.1% of the market cap weighted QQQ and SPY. Those are all-time records for two names, eclipsing IBM (IBM) and Exxon (XOM) from the late 1980s.
In fact, 7 companies – AAPL, MSFT, AMZN, GOOGL, TSLA, NVDA, and META – make up 51.1% of the Nasdaq and 24.22% of the S&P 500.
So, when you say you’re trading or investing in the ‘stock market’ via one of these index ETFs, what you really mean is your buying some form of the old FANG acronym.
Take away those top-tier names and you take away all the gains.
The narrowness of this rally is concerning. I’m not sure how much longer these large cap generals can advance (AAPL, MSFT, TSLA and NVDA are up 15%, 18%, 75% and 110% YTD) without the rest of the soldiers following orders.
My opinion, and the way I’m starting to position Options 360 – which is now up 23% for the year to date – is that there will be a reversion to the mean. Meaning, I expect the generals to retreat in the coming weeks.
If you would like to learn more about options trading, be sure to join my students and I in my exclusive options trading service, Options 360. Not only will you get a world-class options trading education, but you’ll also get to trade alongside me and thousands of other traders. You’ll receive notification of every move I make, so you never miss out on our winner.