Investing Advice: Don’t Use Calendar Spreads Too Much
By: Steve Smith

I understand the attraction with calendar spreads, I really do. What’s not to like about a long volatility income trade? They seem like sound investing advice, in a lot of situations.
Their risk profile looks fantastic, especially if the stock closes right at your strike price at expiry.
And given calendars are already lay-payout plays even if the underlying moves towards the strike you need to wait until expiration to realize any meaningful profit.
So basically, you have to pick the exact price at the exact time. What are the chances of that happening?
What I don’t like about calendar spreads is that you want the stock to stay within a specified range, yet they are long Vega. Isn’t that an oxymoron?
How can the volatility of a stock increase while it remains range bound?
Sure, you can use calendar spreads that are out-of-the-money and therefore incorporate a directional trade but I think there are better strategies for a directional move, such as simple vertical spreads, in which you can realize maximum profits prior to expiration.
The other problem with calendar spreads is that you are trading two different expiry, and are therefore exposed to volatility skew.
As with any models of investing advice, you want to buy low and sell high. The same goes for implied volatility. When trading calendar spreads, you want to make sure that the implied volatility of the option you are buying is not too expensive relative to the option you are selling.
A good rule of thumb is that the back month IV should not be more than about 1% higher than the front month.
Option payoff graphs also can give unrealistic expectations for the unwary trader. For ease of calculation, all payoff graphs assume that the implied volatility of the 2 options converge at expiry of the front month. That’s not always the case.
What happens if volatility in the back month unexpectedly drops as the front month expiry draws near? You’re left with a much lower return than anticipated, that’s what.
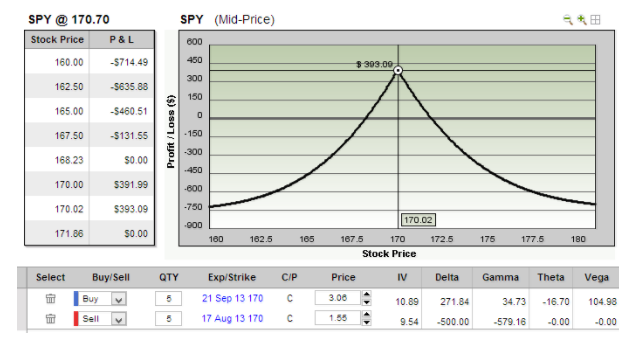
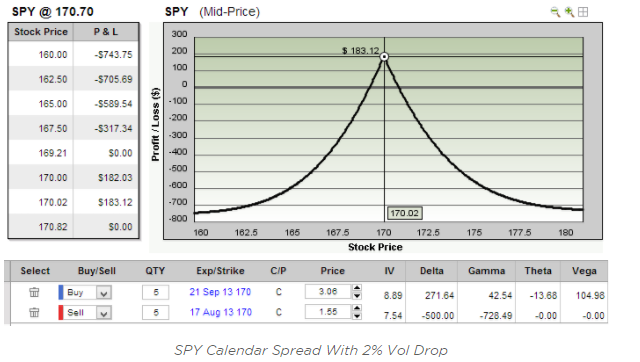
Check out these calendar spread payoff graphs. Look what happens if we have a 2% drop in volatility?

Now drop IV by a mere 2%, and:

As you can see, your maximum potential profit drops from $393 to $183. That’s a pretty big drop, and that’s just from a 2% drop in volatility.
That said, with volatility near historic lows there may be some nice set ups in name that have already reported earnings in which a calendar spread makes sense.
 Related: Use The Butterfly Strategy to Exploit Market Volatility!
